Understanding the Conference Emissions Landscape: A Green ICANN Perspective.
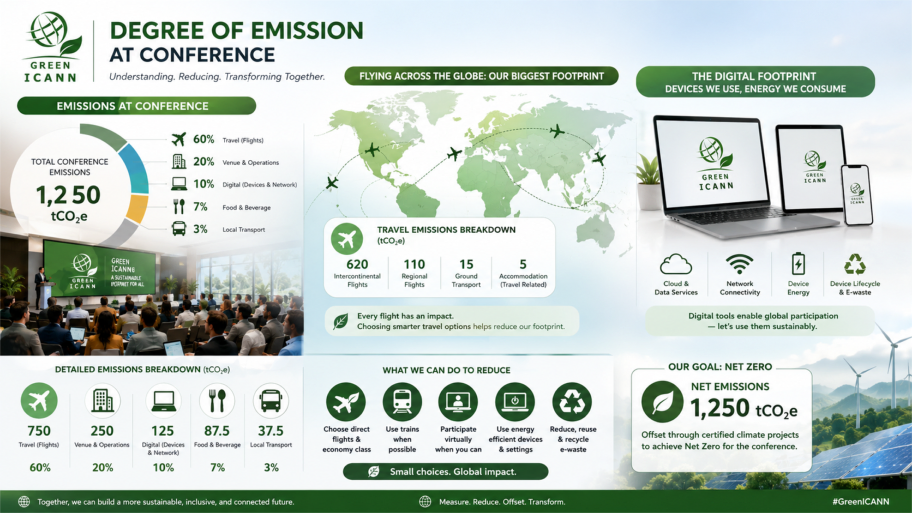
The infographic illustrates the environmental footprint of an international conference, highlighting how modern meetings generate greenhouse gas emissions through both physical travel and digital technology. While conferences are essential for collaboration, innovation, and policy development, they also carry significant environmental costs that must be understood and managed. The image demonstrates how Green ICANN can lead by example by promoting sustainable practices that reduce emissions while maintaining global participation.
Air Travel: The Largest Source of Conference Emissions
At the center of the infographic is a world map connected by flight paths, emphasizing that international air travel is the single greatest contributor to conference-related carbon emissions. Participants often travel thousands of kilometres across continents to attend meetings, resulting in substantial carbon dioxide (CO₂) emissions from commercial aviation.
The visualization reminds us that every flight has an environmental impact. Long-haul international travel consumes large amounts of aviation fuel, making transportation the dominant contributor to a conference’s overall carbon footprint.
Digital Devices: A Hidden Environmental Cost
The right-hand side of the infographic features laptops, tablets, and mobile phones—the essential tools that enable today’s connected meetings. Although digital participation generally produces fewer emissions than international travel, these devices still consume energy throughout their lifecycle.
Their environmental impact includes:
- Electricity used during operation
- Energy consumed by cloud computing and data centres
- Network infrastructure supporting internet connectivity
- Manufacturing and transportation of electronic devices
- Electronic waste generated at the end of a device’s life
The message is clear: digital technologies are enabling greener participation, but they must also be powered efficiently and used responsibly.
Conference Operations
Beyond travel and technology, conferences generate emissions through everyday operational activities, including:
- Meeting venues and building energy use
- Heating, ventilation, and air conditioning
- Lighting and audiovisual equipment
- Catering and food services
- Ground transportation
- Accommodation
- Printed materials and conference merchandise
Each of these activities contributes incrementally to the event’s overall carbon footprint.
The Role of Virtual Participation
One of the key themes illustrated by the infographic is that virtual and hybrid participation can significantly reduce emissions. By allowing participants to join remotely using laptops, tablets, or smartphones, organizations can dramatically reduce the need for long-distance air travel while maintaining global engagement.
Hybrid conferences provide the opportunity to:
- Reduce international flights
- Lower accommodation demand
- Minimize local transportation
- Decrease venue energy consumption
- Expand participation to individuals who may not otherwise be able to attend
Building a Sustainable Digital Ecosystem
The infographic also highlights that digital infrastructure itself should become more sustainable. Green ICANN envisions an internet ecosystem powered by renewable energy, supported by energy-efficient data centres, and strengthened through responsible device management.
This includes:
- Using renewable-powered cloud services
- Improving energy efficiency across internet infrastructure
- Extending the lifespan of electronic devices
- Promoting repair, reuse, and recycling of equipment
- Reducing electronic waste through responsible procurement
Measuring to Improve
An important message conveyed by the image is that organizations cannot reduce what they do not measure. Calculating conference emissions allows planners to identify the largest emission sources and implement targeted strategies for improvement.
Typical categories include:
- Air travel
- Venue operations
- Accommodation
- Ground transportation
- Digital infrastructure
- Food and catering
- Materials and waste
By monitoring these categories over time, organizations can establish measurable sustainability goals and track progress toward carbon reduction.
Green ICANN’s Vision
The infographic reflects a broader vision for Green ICANN: creating a more sustainable model for global Internet governance. Rather than eliminating international collaboration, the objective is to make collaboration smarter, cleaner, and more efficient through a balanced combination of responsible travel, digital innovation, renewable energy, and environmentally conscious decision-making.
Every conference presents an opportunity to reduce emissions while preserving the openness, inclusiveness, and global participation that define the Internet community.
Conclusion
The image serves as a powerful reminder that conference emissions extend far beyond the meeting room. Flights across the globe, the operation of digital devices, cloud infrastructure, and event logistics all contribute to an organization’s environmental footprint. However, by embracing sustainable travel policies, energy-efficient technologies, hybrid participation, and renewable-powered digital infrastructure, organizations such as Green ICANN can demonstrate leadership in climate responsibility while continuing to connect the world’s Internet community.
About The Author